Q2 2026 New York Residential Real Estate Market Report

Manhattan • Brooklyn • Queens • The Bronx • Long Island
Reporting period: April 1–June 30, 2026
Market focus: Residential sales, pricing, inventory, buyer demand and market direction.
Q2 2026 confirmed that New York’s residential market is firm rather than overheated. Prices continued to rise across the major markets, but transaction activity remained uneven.
NYC’s four-borough residential market recorded approximately 7,070 sales during Q2, essentially flat year over year, while the median sale price reached a record $825,000, up 3% year over year. Manhattan reached another record, while Brooklyn and Queens remained close to historic highs. The Bronx was the strongest borough for transaction growth, with sales up approximately 16% year over year.
The most important distinction in Q2 was between closed sales and forward-looking demand. Manhattan contracts increased 5% year over year to 3,477, while Brooklyn contracts jumped 15% to 1,207. That suggests the second half of 2026 could be more active than the closing statistics from Q2 alone imply.
At the same time, limited supply continued to support prices in Manhattan and the higher-end segments of Brooklyn. Queens and Long Island offered buyers somewhat more inventory, although affordability remained a major constraint.
Q2 2026 Market Snapshot
Important: The Queens discrepancy illustrates why market reports should identify their data source. OneKey MLS reports a $825K Q2 median for its single-family-home/condo dataset, while PropertyShark’s ACRIS methodology, which includes single-family homes, condos and co-ops and excludes Staten Island, reports a $595K Queens median. These are not necessarily contradictory; they measure different universes of transactions.
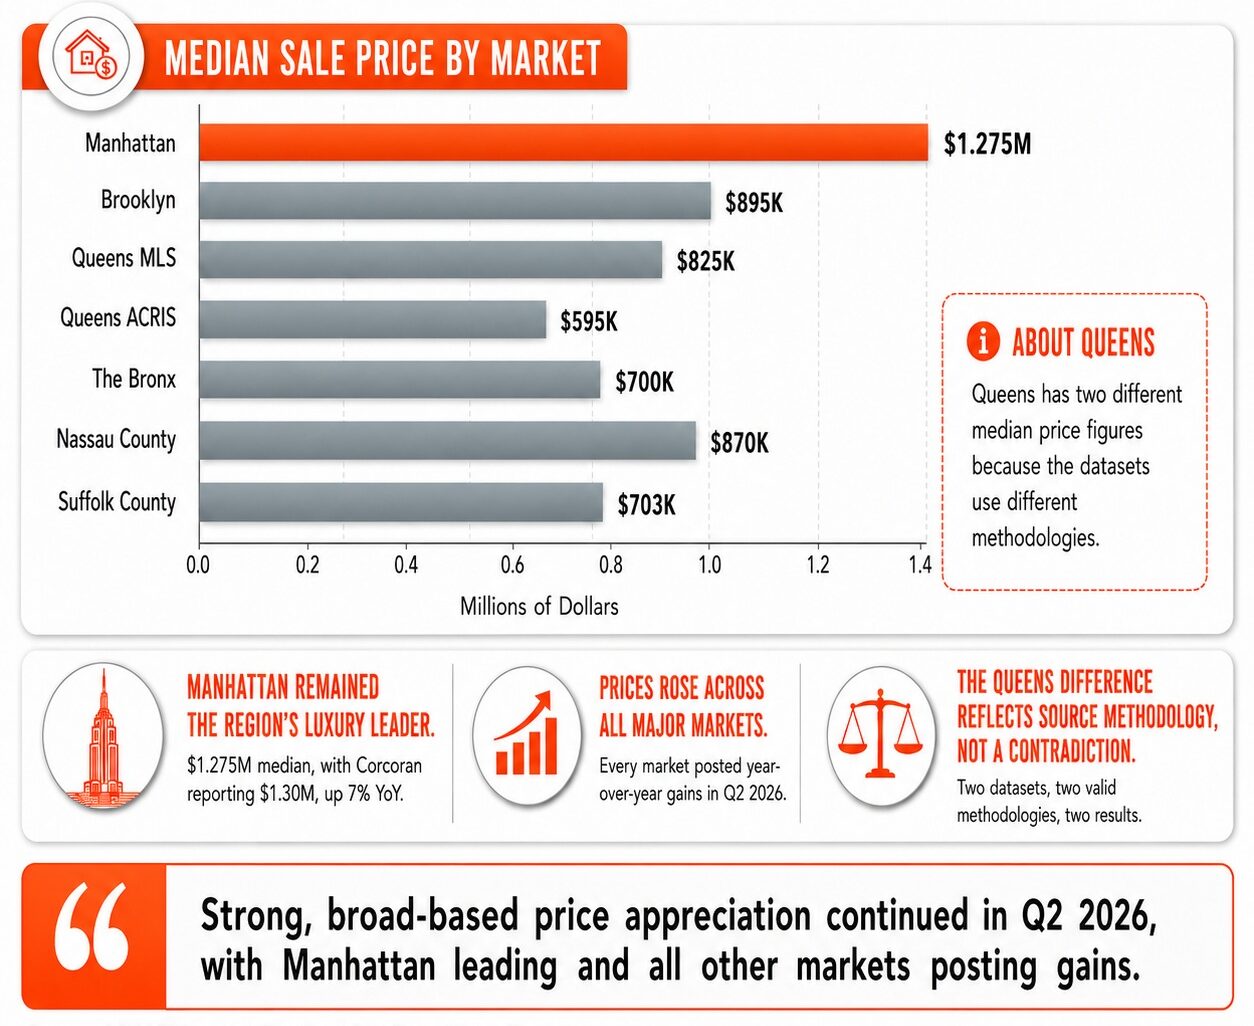
Median Price Comparison
Manhattan
Manhattan remained the region’s clear luxury leader. PropertyShark recorded a $1.275 million median, a new historic high, while Corcoran reported a $1.3 million median for its broader Manhattan dataset, up 7% year over year.
The more significant story, however, was demand. Signed contracts rose 5% year over year to 3,477, the highest second-quarter level in five years. Contracts above $3 million increased 17%, demonstrating that high-net-worth buyers remained active despite higher financing costs and tax uncertainty.
Inventory fell to 7,182 listings, down 2% year over year and representing the lowest second-quarter inventory level in eight years. New-development launches fell 37% to only 160 units.
Manhattan takeaway:
A supply-constrained seller’s market persists for desirable properties, particularly luxury condos, turnkey residences and well-located properties.
Brooklyn
Brooklyn experienced one of the most interesting Q2 performances in the region.
The divergence between closings and contracts is particularly important. Closed sales reflect deals negotiated months earlier, while signed contracts provide a more current indication of buyer behavior.
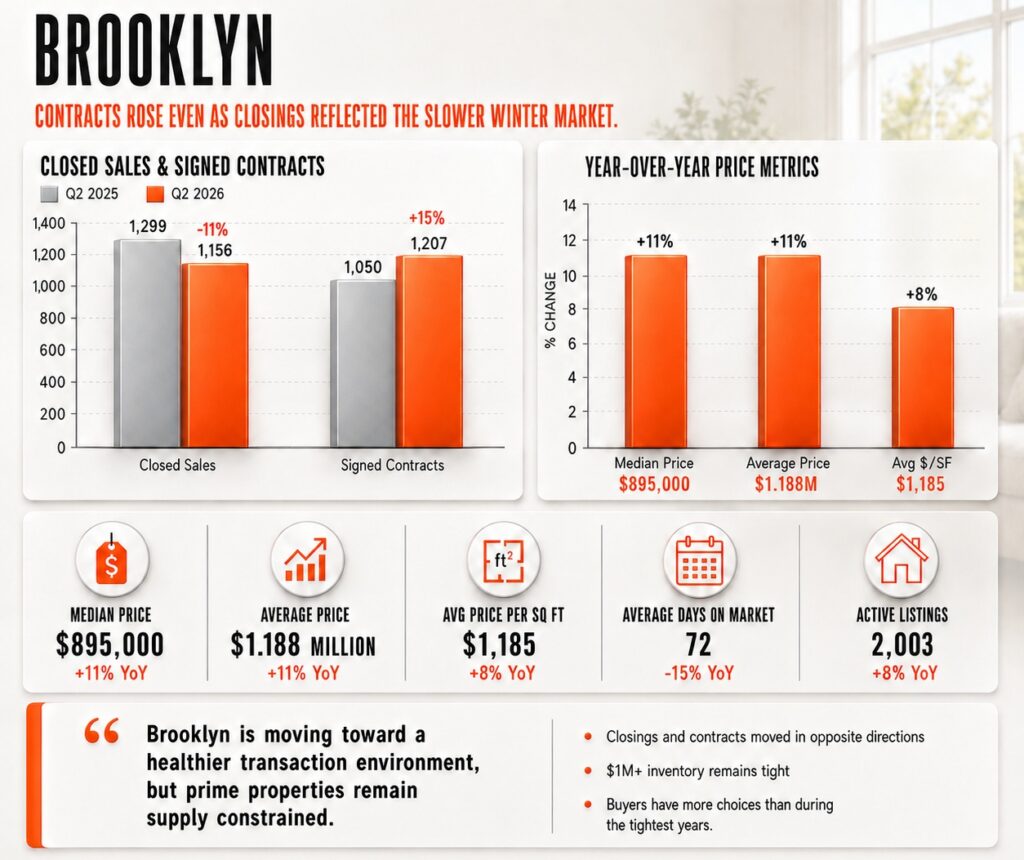
Brooklyn’s market is increasingly segmented. The resale condo median reached $1.15 million, while the $1M+ segment faced declining inventory even as overall inventory increased.
Brooklyn takeaway:
The market is shifting toward a healthier transaction environment, but prime properties remain supply constrained. Buyers have more choices than during the tightest years, yet desirable properties are still attracting competition.
Queens
Queens was more balanced than Manhattan and Brooklyn.
This is an important change in market dynamics. Inventory is growing substantially faster than sales, giving buyers more negotiating leverage than they had during the tightest phases of the market.
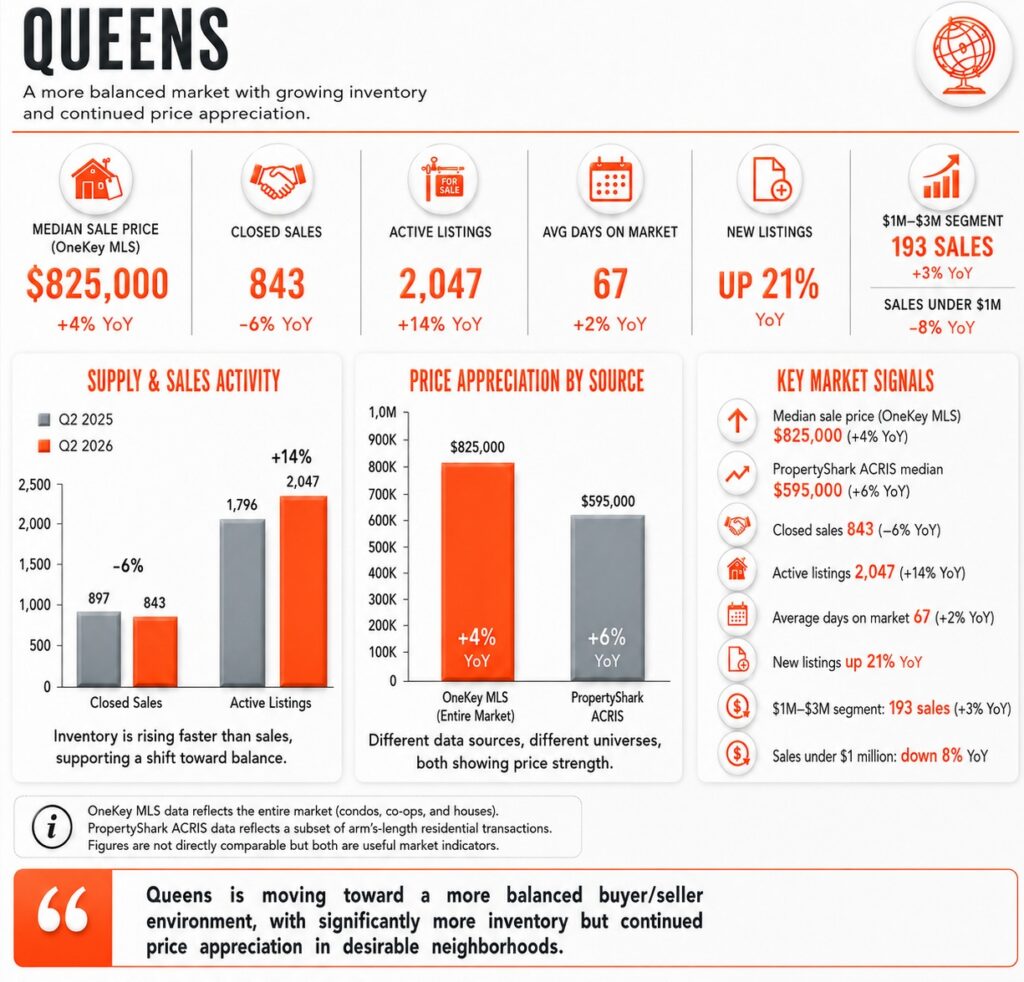
At the same time, the higher end remains active. Queens’ $1M–$3M segment recorded 193 sales, up 3%, while sales under $1 million declined 8%.
PropertyShark’s ACRIS analysis produced a lower borough-wide median of $595,000, but also showed Queens prices rising approximately 6% year over year. The difference is primarily methodological and reinforces the importance of defining the property types included in a market report.
The Bronx
The Bronx remains one of New York’s most affordability-oriented ownership markets.
Q2 data indicates particularly strong transaction growth. PropertyShark reported 16% year-over-year growth in Bronx transactions, the strongest growth among the four NYC boroughs it analyzed. Regional market reporting also placed the Bronx median around $700,000, with closed sales increasing approximately 25.7% year over year in its OneKey-based dataset.
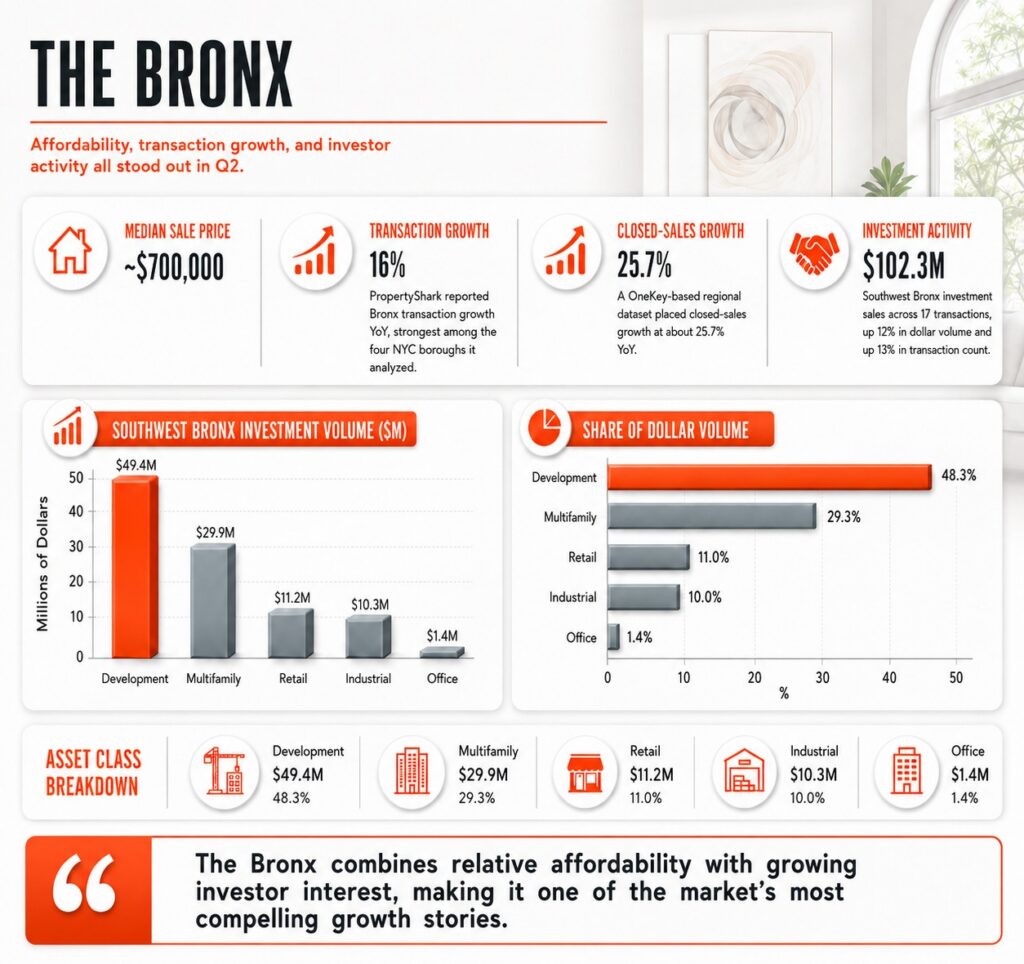
The Bronx is also attracting investment capital. In Southwest Bronx alone, Q2 investment sales totaled $102.3 million across 17 transactions, up 12% in dollar volume and 13% in transaction count year over year. Development accounted for 48.3% of dollar volume.
Long Island
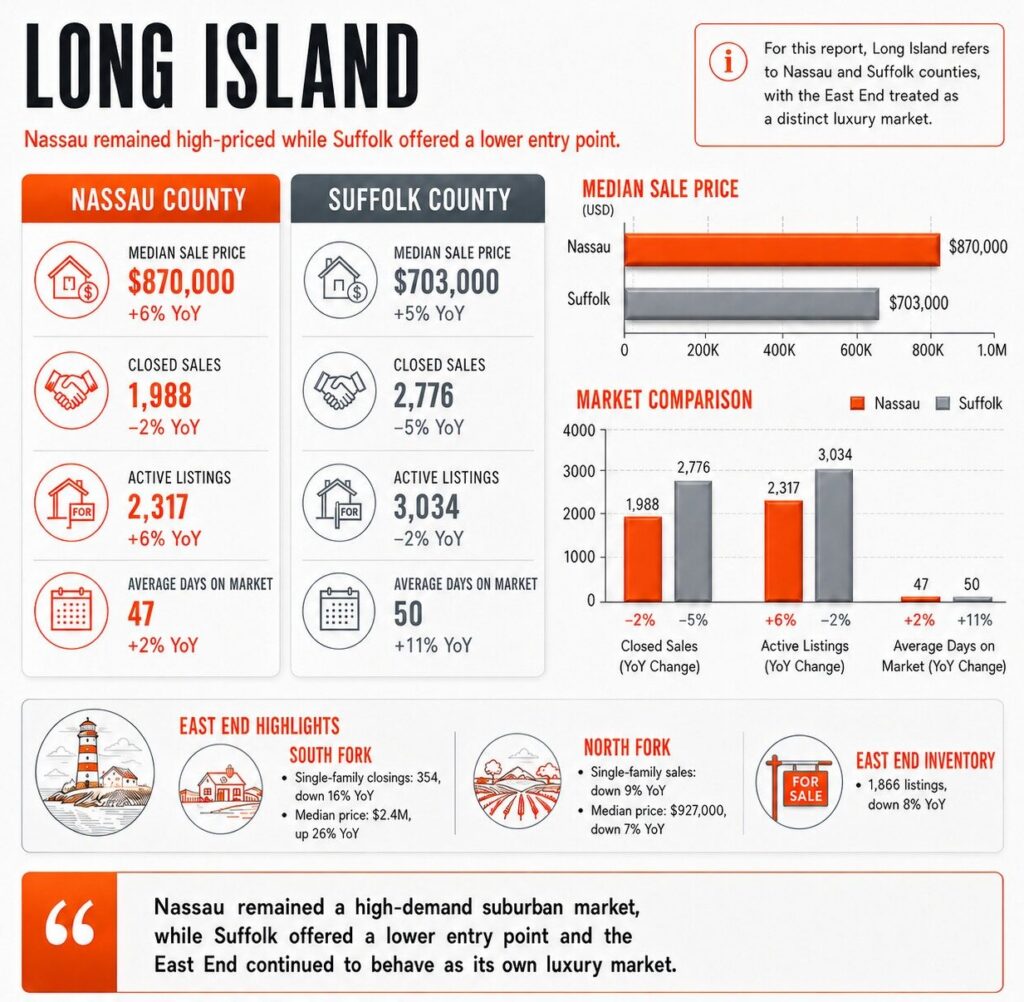
For this report, Long Island means Nassau and Suffolk counties, rather than Brooklyn and Queens.
Nassau County
Nassau remained one of the region’s strongest price markets outside Manhattan.
The composition of demand is particularly interesting. Sales below $1 million declined 9%, while transactions between $1 million and $3 million increased 11%. Sales between $3 million and $5 million jumped 60%, and sales above $5 million rose 78%, although those high-end categories represent relatively small transaction counts.
Suffolk County
Suffolk’s Q2 median was $703,000, up 5% year over year.
The combination of higher prices and fewer transactions indicates that affordability remains a significant constraint.
East End
The luxury East End market was considerably more volatile.
On the South Fork, single-family closings fell 16% to 354, while the median price climbed 26% to $2.4 million. North Fork single-family sales fell 9%, with the median declining 7% to $927,000. East End inventory ended June at 1,866 listings, down 8% year over year.
Long Island takeaway:
Nassau remains a high-demand, high-price suburban market, while Suffolk offers a lower entry point. The East End continues to operate as a distinct luxury market where transaction volume can fluctuate significantly from quarter to quarter.
Price Appreciation Across the Market
The strongest reported price appreciation was in the Bronx and Brooklyn, although their market structures are very different.
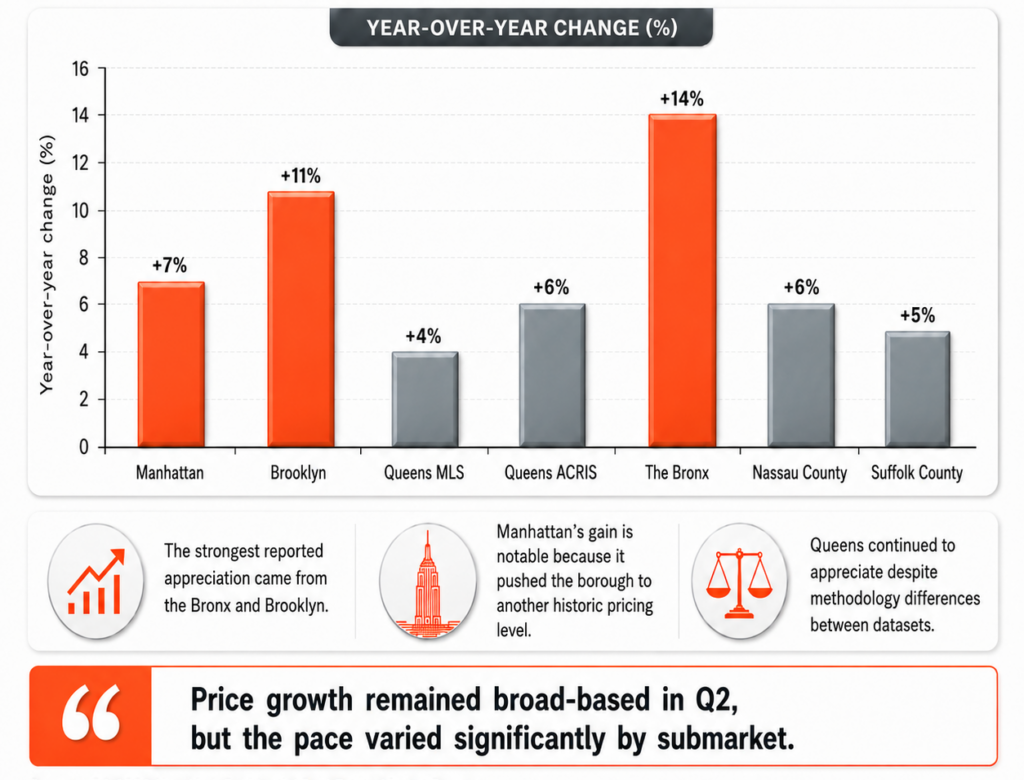
Brooklyn’s 11% increase was accompanied by record pricing and strong contract activity. The Bronx’s reported 14% increase reflects a market with a lower overall price point and stronger transaction growth. Manhattan’s 7% gain is especially significant because it pushed the borough to another historic pricing level despite limited supply
Inventory: The Key Story of Q2
Supply conditions varied significantly by geography.
Manhattan’s inventory decline was particularly important because demand simultaneously strengthened. Corcoran described the borough’s 7,182 active listings as its lowest second-quarter inventory in eight years.
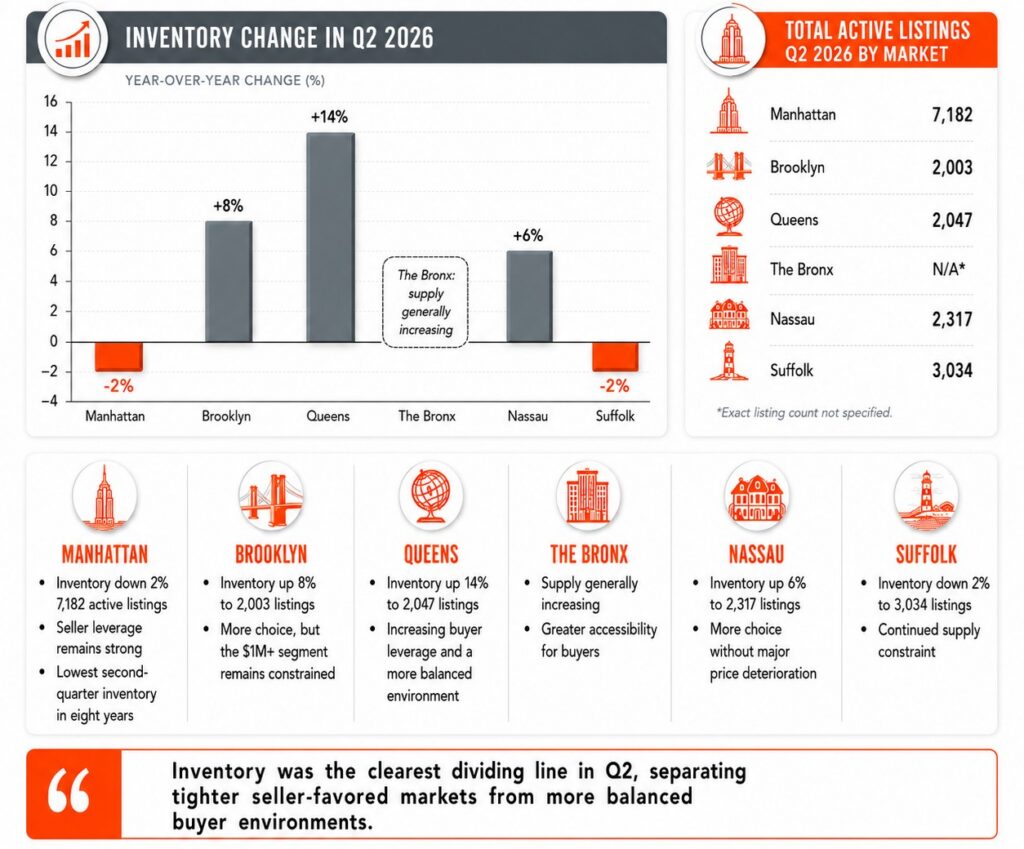
Brooklyn, in contrast, saw inventory rise to 2,003 listings, its highest second-quarter level since early 2022.
Queens experienced an even larger 14% increase in inventory, creating a noticeably more balanced environment.
The Rental Market Is Supporting Ownership Demand
The sales market cannot be viewed independently from New York’s rental market.
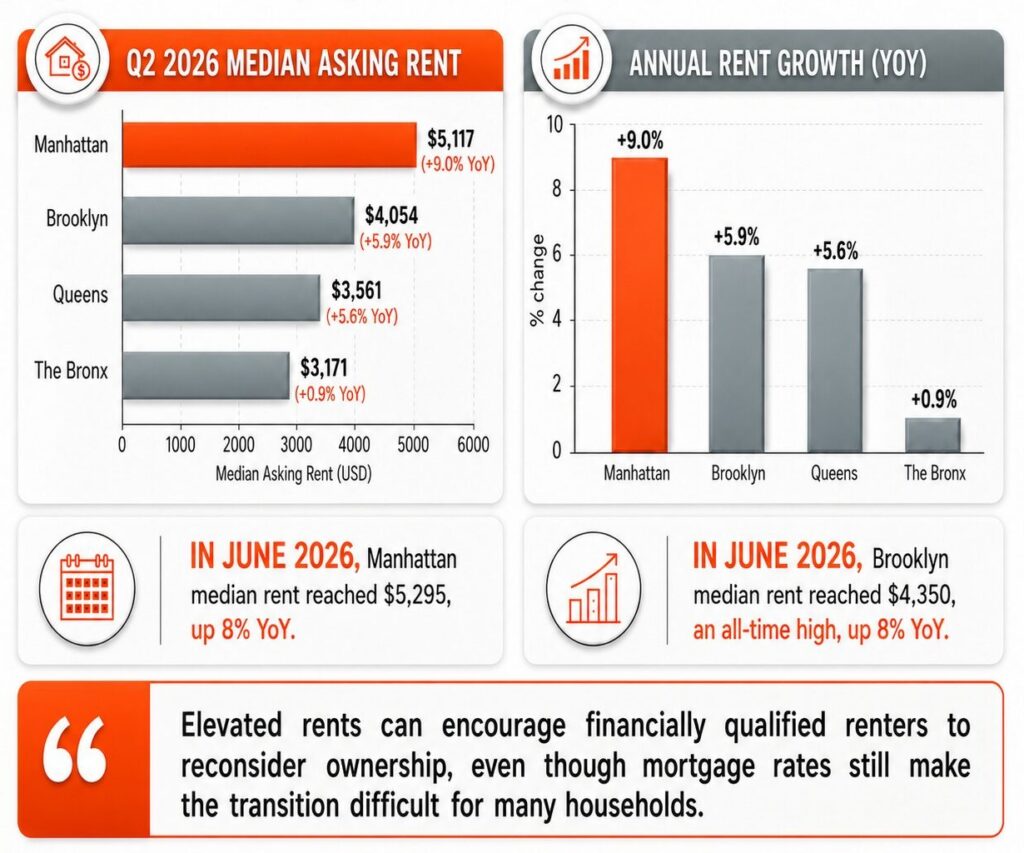
In June 2026, the median Manhattan rent reached $5,295, up 8% year over year. Brooklyn’s median reached $4,350, also an all-time high and up 8% annually. A separate Q2 rental analysis showed median asking rents of approximately:
This creates an important dynamic: elevated rents can encourage financially qualified renters to reconsider ownership, but mortgage rates still make the transition difficult for many households.
What Q2 Means for Buyers
Manhattan
Buyers should expect continued competition for well-priced properties. The best opportunities are likely to come from properties requiring renovation, units with longer marketing histories and sellers who need certainty.
Brooklyn
The expanding inventory gives buyers more choice, but competition remains intense above $1 million. Buyers should distinguish between neighborhoods where inventory is genuinely increasing and neighborhoods where supply remains scarce.
Queens
Queens may provide one of the better negotiating environments in NYC. Inventory rose substantially faster than sales, making inspections, contingencies and price negotiations more realistic.
Bronx
The Bronx continues to offer the lowest entry points among the major NYC boroughs, while improving transaction activity could create additional competition in desirable neighborhoods.
Long Island
Buyers should be prepared for limited affordability, particularly in Nassau. Suffolk offers a lower entry point but remains supply constrained in many communities.
What Q2 Means for Sellers
The Q2 data does not support a broad “wait for prices to collapse” strategy.
Instead, the market is increasingly price sensitive.
Properties that are:
- correctly priced,
- renovated or turnkey,
- located near transportation,
- in strong school districts,
- or positioned within highly desirable neighborhoods
continue to attract buyers.
Overpricing, however, is becoming increasingly risky as inventory expands in markets such as Queens and Brooklyn.
Bottom Line
Q2 2026 was not a boom-and-bust quarter for New York real estate. It was a quarter of normalization and segmentation.
Prices continued to rise across the region, but buyers became increasingly selective. Manhattan and prime Brooklyn remained supply constrained, while Queens offered buyers more inventory and negotiating power. The Bronx benefited from relative affordability and strong transaction growth. On Long Island, Nassau remained expensive and competitive while Suffolk provided a comparatively lower entry point.
The biggest forward-looking indicator is contract activity: demand is strengthening even where closed sales remain subdued.
For the remainder of 2026, the market is likely to reward accurate pricing, quality inventory and neighborhood-specific strategy rather than broad assumptions about whether NYC is a buyer’s or seller’s market.
About SPiRALNY
Focused on providing a full-service real estate experience, SPiRALNY strives to answer the needs of clients with a sense of detail, care, and efficiency. Our agents work tirelessly to make the process of buying, selling, or renting seamless and exciting.
With an encouraging company culture, cutting-edge technology, and extensive training resources, SPiRALNY agents are destined for success.