Q3 2026 New York Residential Real Estate Market Report

Manhattan • Brooklyn • Queens • The Bronx • Long Island
Market period: July–September 2026
Data availability: Through August 2026, with September indicators where available
The third quarter of 2026 has shown a New York residential market characterized by strong underlying demand, constrained inventory in several markets, rising rents, and significant differences between boroughs.
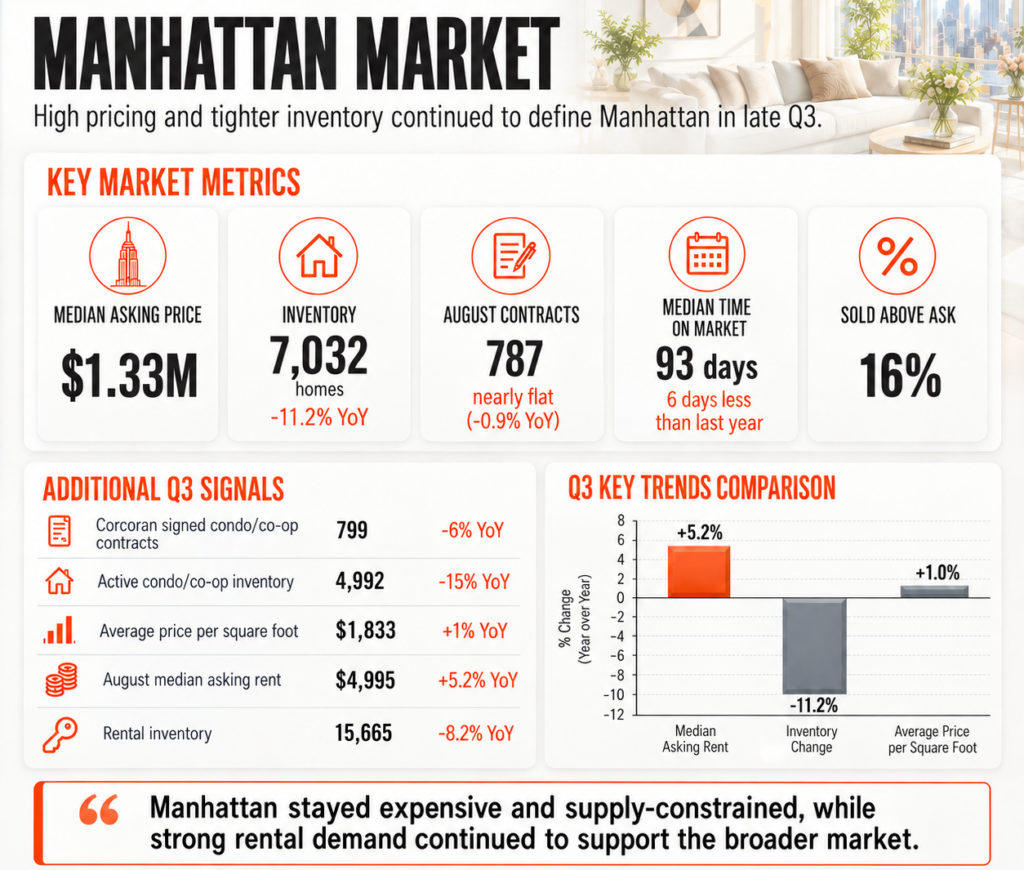
Manhattan entered the second half of the quarter with fewer homes available than a year earlier. In August, Manhattan had 7,032 homes for sale, down 11.2% year over year, while its median asking price was $1.33 million. Brooklyn had 4,016 homes for sale, down only 0.5%, while Queens moved in the opposite direction, with inventory increasing 3.3% to 3,231 homes.
The sales market remained active despite elevated borrowing costs. In July, Manhattan recorded 984 homes entering contract, up 11.1% year over year, while Brooklyn increased 16.8% and Queens increased 28.8%. By August, however, contract activity moderated, with Manhattan contracts down 0.9%, Brooklyn down 10.9%, and Queens down 7.9% year over year.
Rental conditions remained considerably tighter. Manhattan’s August median asking rent reached $4,995 according to StreetEasy, up 5.2% from a year earlier, while Brooklyn reached $3,995 and Queens $3,450.
Outside New York City, Long Island continued to experience price appreciation. OneKey MLS reported August single-family median sales prices of $911,000 in Nassau County and $760,000 in Suffolk County, representing annual increases of 4.7% and 7.0%, respectively.
Manhattan Market
Manhattan remained the highest-priced of the major NYC residential markets covered in the StreetEasy August data. The median asking price was $1.33 million, down 4.9% year over year.
At the same time, available inventory contracted substantially. Manhattan had 7,032 homes for sale, 11.2% fewer than in August 2025. The reduction in available properties helped keep the market relatively active despite higher financing costs.
There were 787 homes entering contract in August, almost unchanged from the previous year, while median time on market was 93 days, six days fewer than a year earlier. Sixteen percent of homes that sold in August closed above their latest asking price.
Corcoran’s condominium and co-op data provides another view of Manhattan. August recorded 799 signed condo/co-op contracts, down 6% annually, while active inventory fell 15% to 4,992 units. Average price per square foot increased 1% to $1,833.
Manhattan rental market
Rental demand remained particularly strong. StreetEasy reported an August median asking rent of $4,995, 5.2% higher than a year earlier, while available rental inventory declined 8.2% to 15,665 units.
Corcoran reported an even higher August Manhattan median of $5,285, illustrating why methodology and dataset selection matter when comparing rental statistics. Its report also showed only 5,107 active listings in its particular dataset and a 1.51% vacancy rate.
Brooklyn Market
Brooklyn continued to display strong buyer competition even as the market became more selective.
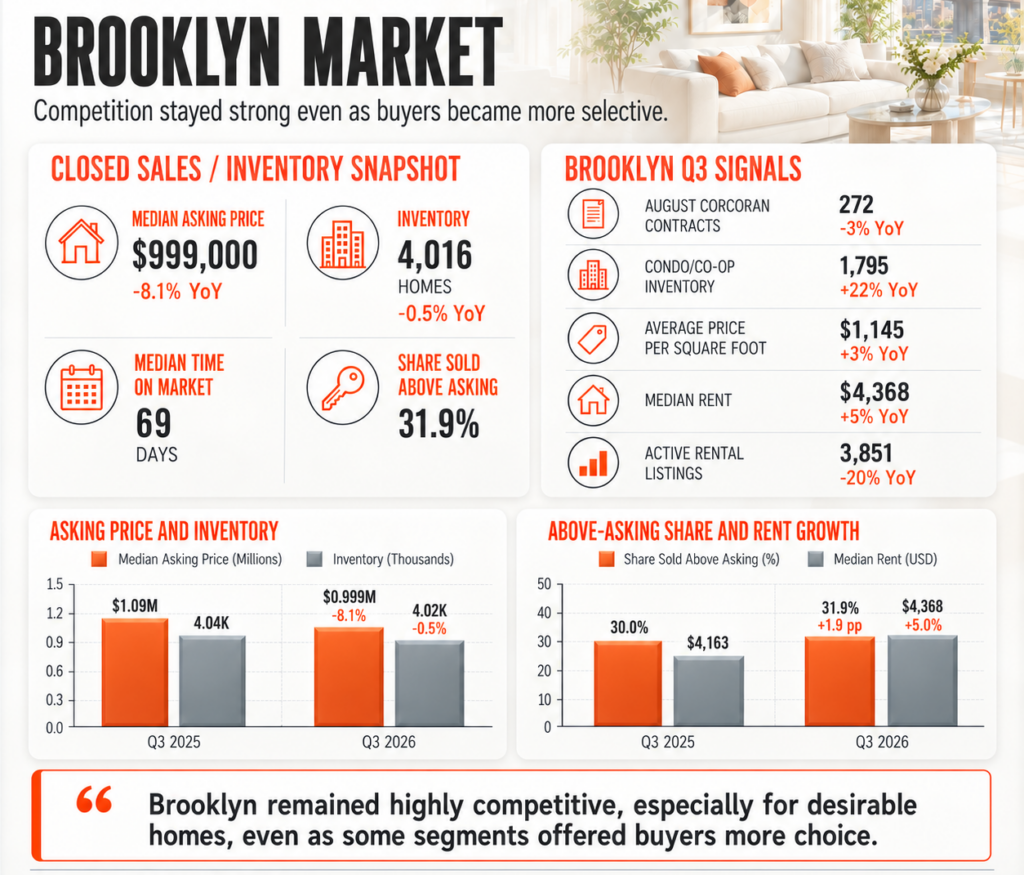
StreetEasy reported an August median asking price of $999,000, down 8.1% year over year. Inventory was relatively stable at 4,016 homes, down only 0.5%. Median time on market was 69 days.
Brooklyn stood out for its level of competition: 31.9% of homes sold above their latest asking price in August, the highest share among the NYC boroughs tracked by StreetEasy.
Corcoran’s condominium/co-op data showed a somewhat different picture. Brooklyn recorded 272 contracts in August, down 3% annually, but inventory increased 22% to 1,795 active listings. Average price per square foot rose 3% to $1,145.
This combination suggests a market where buyers have more choices in some segments, but desirable properties can still attract substantial competition.
Brooklyn rental market
Brooklyn’s rental market remained supply constrained. Corcoran reported a median rent of $4,368 in August, a new record in its dataset and 5% above the previous year. Active rental listings fell 20% to 3,851.
Queens Market
Queens continued to differentiate itself from Manhattan and Brooklyn through comparatively stronger inventory growth.
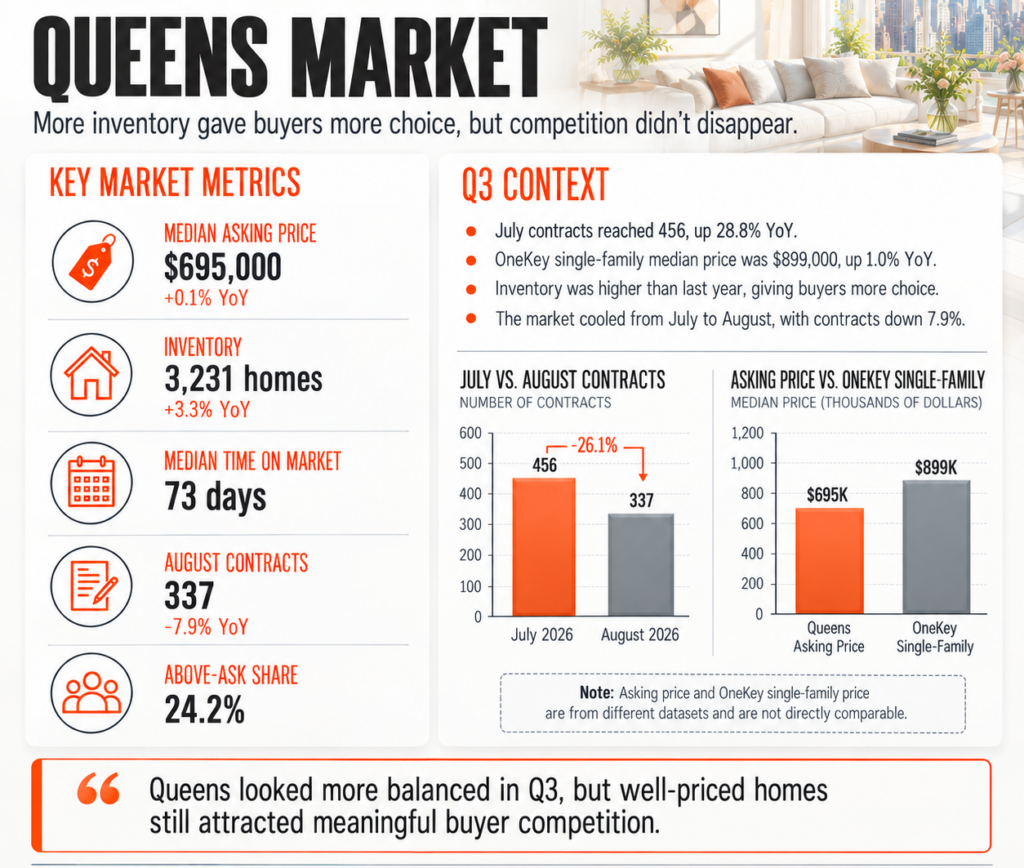
The August median asking price was $695,000, essentially unchanged from a year earlier at +0.1%. However, inventory increased 3.3% to 3,231 homes. Median time on market rose to 73 days.
Queens also recorded 337 homes entering contract in August, down 7.9% year over year. Even with that decline, 24.2% of homes that sold were above their latest asking price.
The July data had been considerably stronger: 456 homes entered contract, representing a 28.8% year-over-year increase. This suggests that the market cooled somewhat as Q3 progressed rather than moving uniformly in one direction.
OneKey MLS reported a different but useful measure for Queens: the August median single-family sales price was $899,000, up 1.0% from August 2025. This figure represents closed single-family transactions and therefore should not be directly compared with StreetEasy’s median asking price.
Bronx Market
The Bronx continues to offer a substantially different price structure from Manhattan, Brooklyn and many Long Island communities.
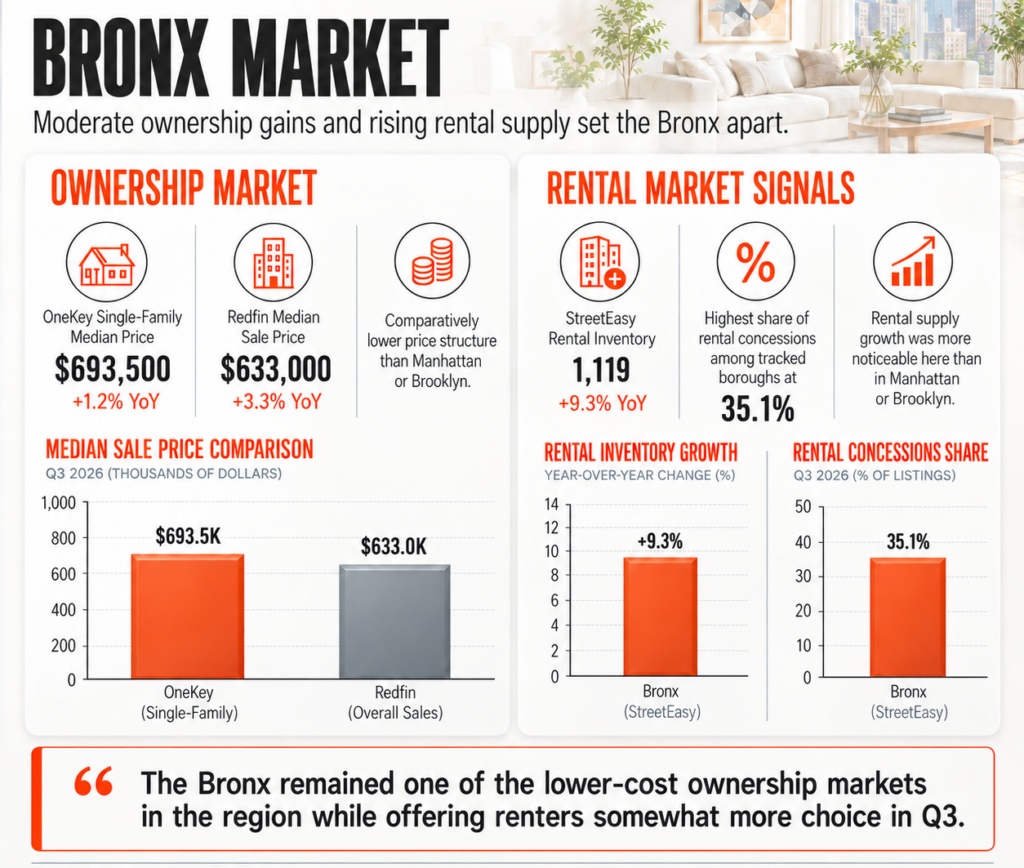
OneKey MLS reported an August 2026 median single-family sales price of $693,500, up 1.2% year over year.
Redfin’s broader Bronx County dataset reported a median sale price of approximately $633,000 for the three months ending August, up 3.3% year over year. The difference between the two figures reflects different datasets and property coverage rather than necessarily a contradiction.
Rental inventory was one of the few areas where the Bronx showed meaningful supply growth. StreetEasy reported 1,119 rental homes in August, an increase of 9.3% year over year. The borough also had the highest share of rental listings offering concessions among the boroughs reported by StreetEasy, at 35.1%.
This makes the Bronx particularly notable within the Q3 report: its ownership market continued to appreciate modestly, while its rental market experienced more inventory growth than Manhattan or Brooklyn.
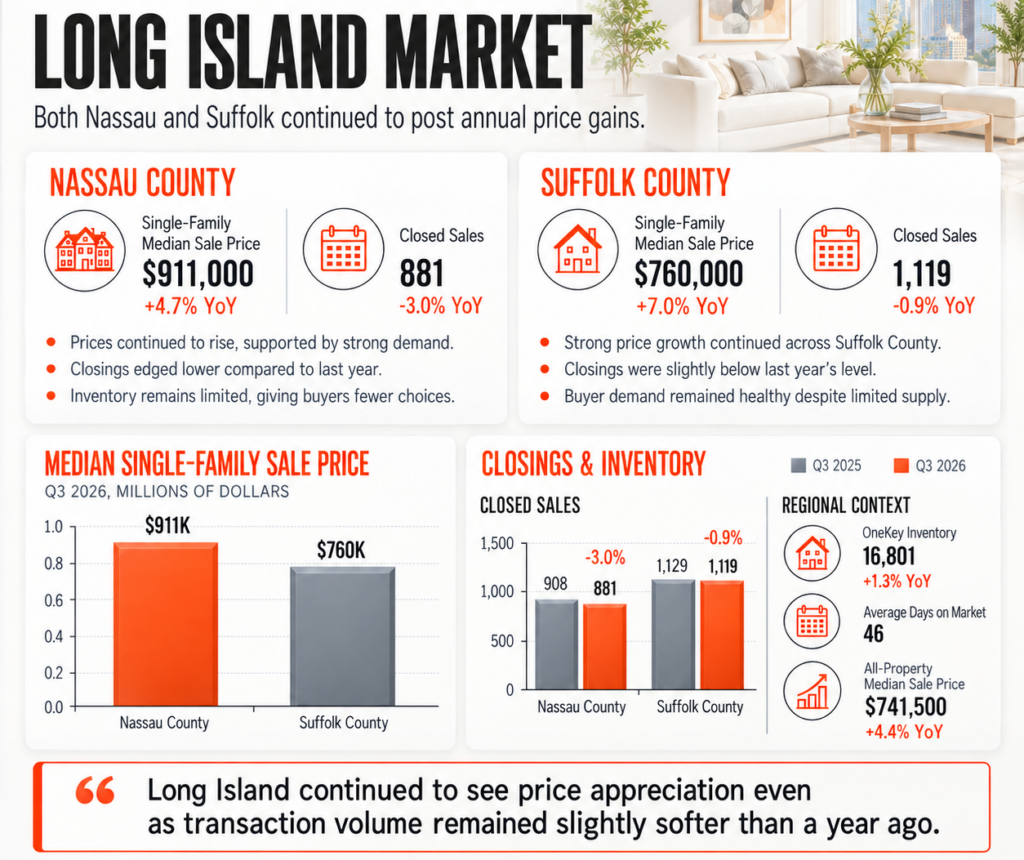
Long Island Market
For this report, Long Island is represented primarily by Nassau and Suffolk Counties, the two major suburban markets immediately east of New York City.
OneKey MLS reported strong year-over-year price growth in August:
| Market | Aug. 2026 single-family median | YoY change |
| Nassau County | $911,000 | +4.7% |
| Suffolk County | $760,000 | +7.0% |
| Queens | $899,000 | +1.0% |
| Bronx | $693,500 | +1.2% |
Nassau County recorded 881 single-family closings in August versus 908 a year earlier, a 3.0% decline. Suffolk recorded 1,119 closings compared with 1,129 in August 2025, a 0.9% decline. Thus, price appreciation continued despite slightly lower transaction volume.
Across the broader OneKey MLS service area, August inventory increased 1.3% year over year to 16,801 homes, while the average time on market remained 46 days. The regional median sale price for all property types increased 4.4% to $741,500.
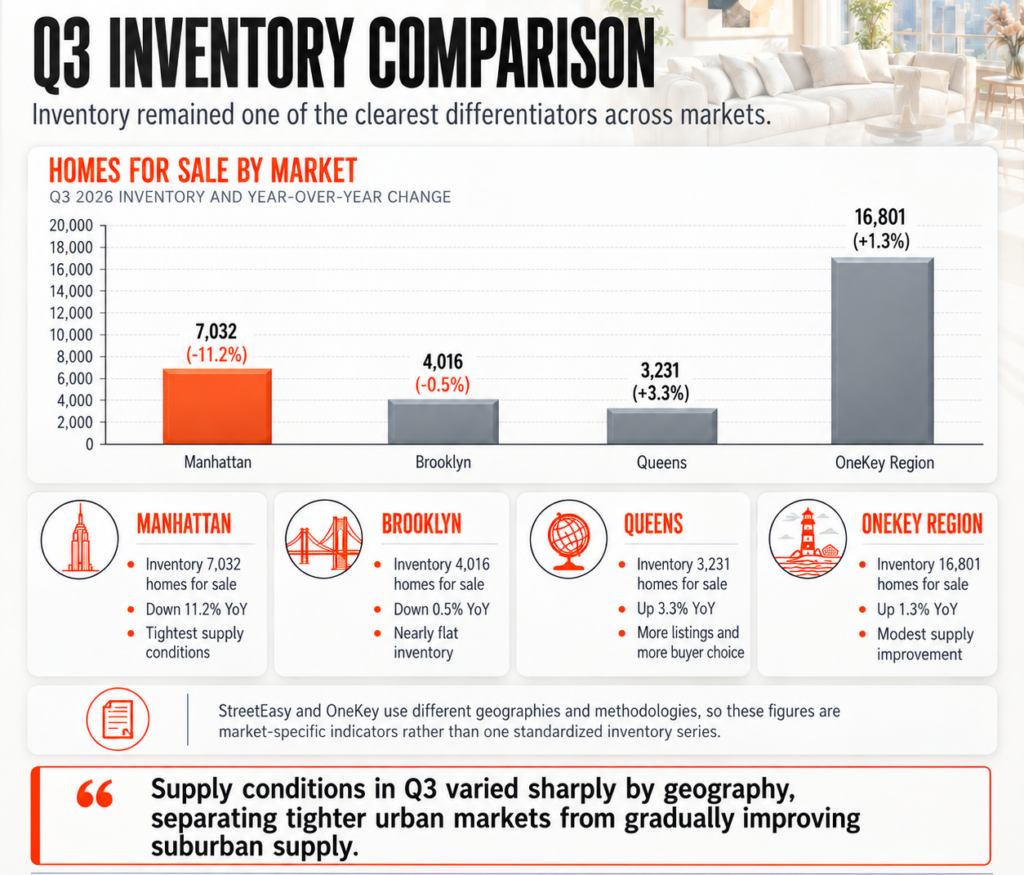
Q3 Inventory Comparison
Inventory has been one of the clearest differentiators between the markets.
| Market | Inventory indicator | YoY change |
| Manhattan | 7,032 homes for sale | -11.2% |
| Brooklyn | 4,016 | -0.5% |
| Queens | 3,231 | +3.3% |
| OneKey region | 16,801 | +1.3% |
StreetEasy and OneKey use different geographic coverage and methodologies, so these figures should be viewed as market-specific indicators rather than a single standardized inventory series.
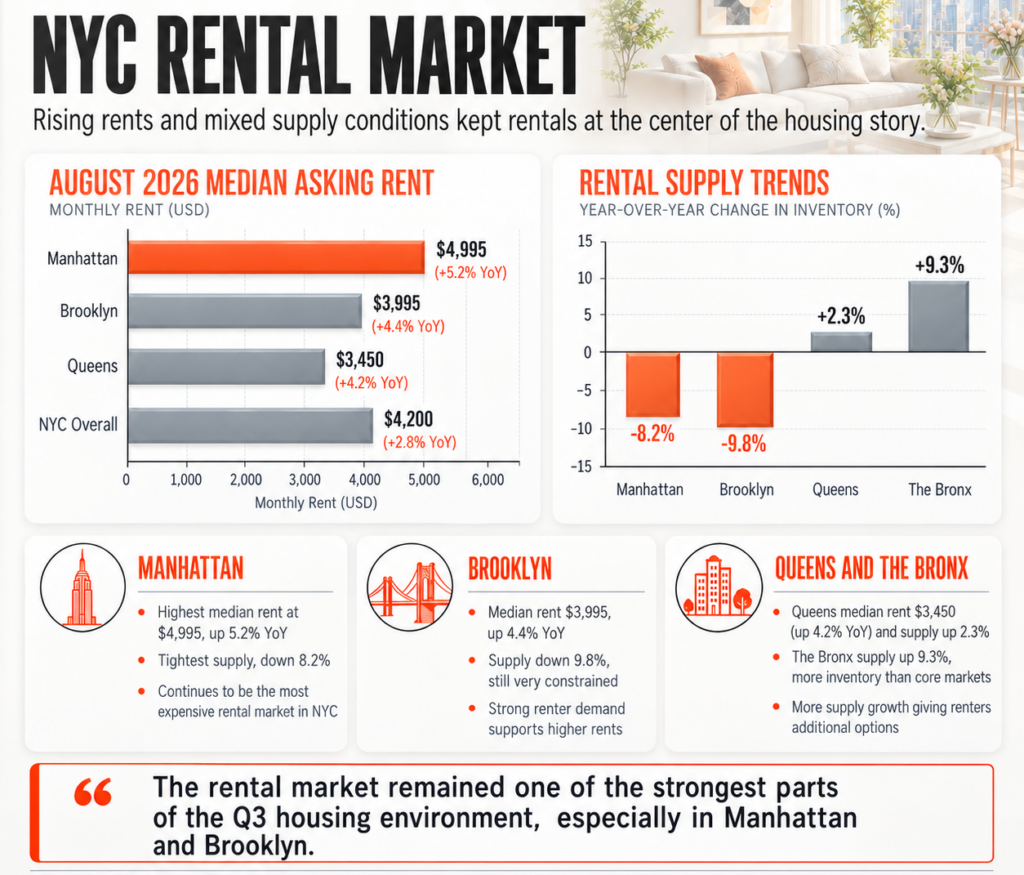
NYC Rental Market
The rental market remained one of the strongest components of the Q3 housing environment.
| Market | August 2026 median asking rent | YoY change |
| Manhattan | $4,995 | +5.2% |
| Brooklyn | $3,995 | +4.4% |
| Queens | $3,450 | +4.2% |
| NYC overall | $4,200 | +2.8% |
The rental supply picture was particularly tight in Manhattan and Brooklyn. Manhattan rental inventory declined 8.2% annually, while Brooklyn inventory declined 9.8%. Queens and the Bronx were exceptions, with rental inventory increasing 2.3% and 9.3%, respectively.
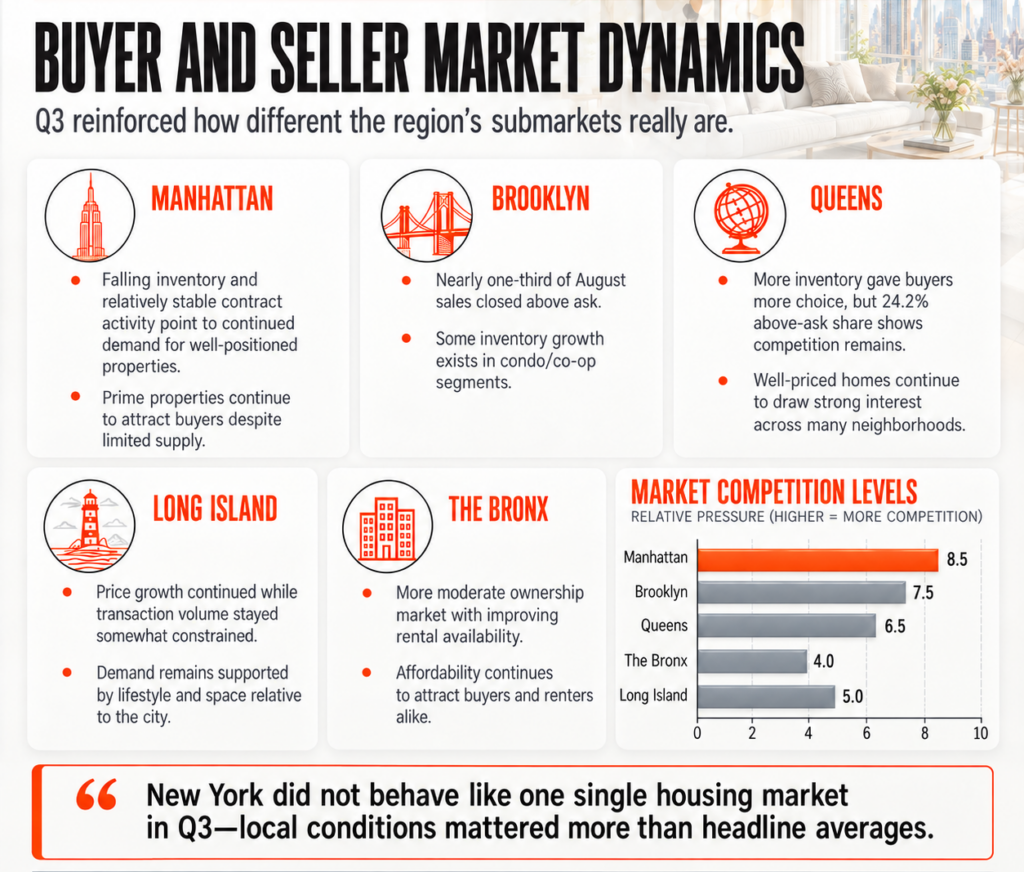
Buyer and Seller Market Dynamics
The Q3 data shows that New York is not one uniform housing market.
Manhattan’s combination of falling inventory and relatively stable contract activity points to continued demand for well-positioned properties, even though the median asking price was below its 2025 level.
Brooklyn demonstrated particularly strong competition, with nearly one-third of August sales closing above the latest asking price. At the same time, Corcoran’s condominium/co-op data showed inventory growing, indicating that market conditions can differ substantially depending on property type and price segment.
Queens had more inventory available than a year earlier, giving buyers somewhat more choice. However, its 24.2% above-asking share in August indicates that increased inventory did not eliminate competition for appropriately priced homes.
Long Island continued to experience price growth while transaction volume remained comparatively constrained. This is consistent with a market in which limited supply continues to support prices despite affordability challenges.
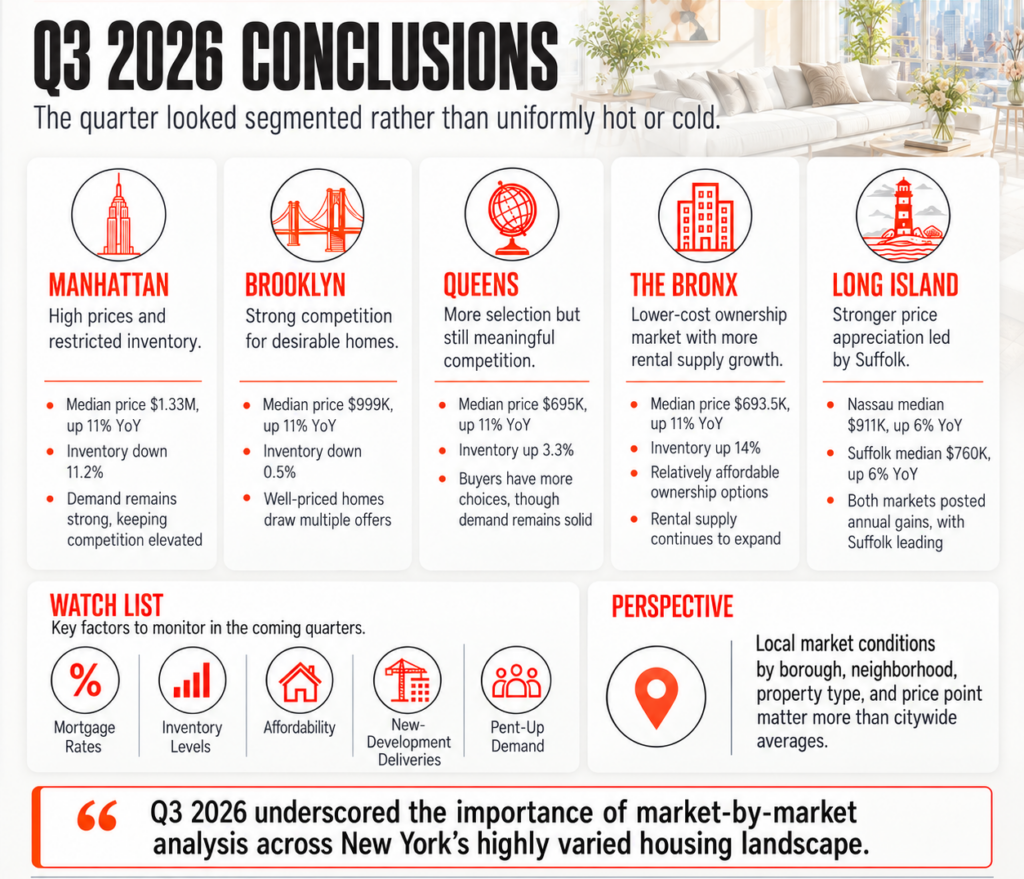
Q3 2026 Conclusions
The third quarter of 2026 is developing as a segmented New York housing market rather than a broad-based boom or slowdown.
Manhattan remains characterized by high prices and restricted inventory, with rental demand providing an important source of market strength. Brooklyn continues to show strong competition for desirable properties while its condominium/co-op inventory has expanded. Queens has gained inventory and consequently offers buyers more selection, although competition remains meaningful for well-priced homes.
The Bronx remains a comparatively lower-cost ownership market within New York City, while its rental inventory growth provides renters with somewhat more choice than in Manhattan and Brooklyn.
Long Island has continued to experience stronger price appreciation, particularly Suffolk County, where the August single-family median rose 7.0% year over year. Nassau also posted a 4.7% increase.
For the remainder of 2026, the most important market variables will be mortgage rates, inventory levels, buyer affordability, new-development deliveries, and the amount of pent-up demand released into the sales market. The September data will be important in determining whether the Q3 trends represent a temporary summer pattern or the beginning of a more durable shift into the fall market.
SPiRALNY’s perspective
For buyers and sellers, the Q3 numbers reinforce the importance of evaluating the specific borough, neighborhood, property type and price segment rather than relying on citywide averages. The differences between Manhattan, Brooklyn, Queens, the Bronx and Long Island are substantial enough that local market conditions can materially change the interpretation of the headline numbers.
About SPiRALNY
Focused on providing a full-service real estate experience, SPiRALNY strives to answer the needs of clients with a sense of detail, care, and efficiency. Our agents work tirelessly to make the process of buying, selling, or renting seamless and exciting.
With an encouraging company culture, cutting-edge technology, and extensive training resources, SPiRALNY agents are destined for success.