Manhattan Real Estate Market Report: Q3 2023

In this analysis, we delve into the Manhattan real estate market, focusing on the trends and shifts observed in July 2023. We examine three key segments: condos, 1-3 family homes, and co-ops, each presenting a unique perspective on the market dynamics. From a significant decrease in new contracts for condos to a surge in demand for 1-3 family homes, and a notable shift towards high-priced properties in the co-op market, this analysis provides a detailed snapshot of the Manhattan real estate landscape.
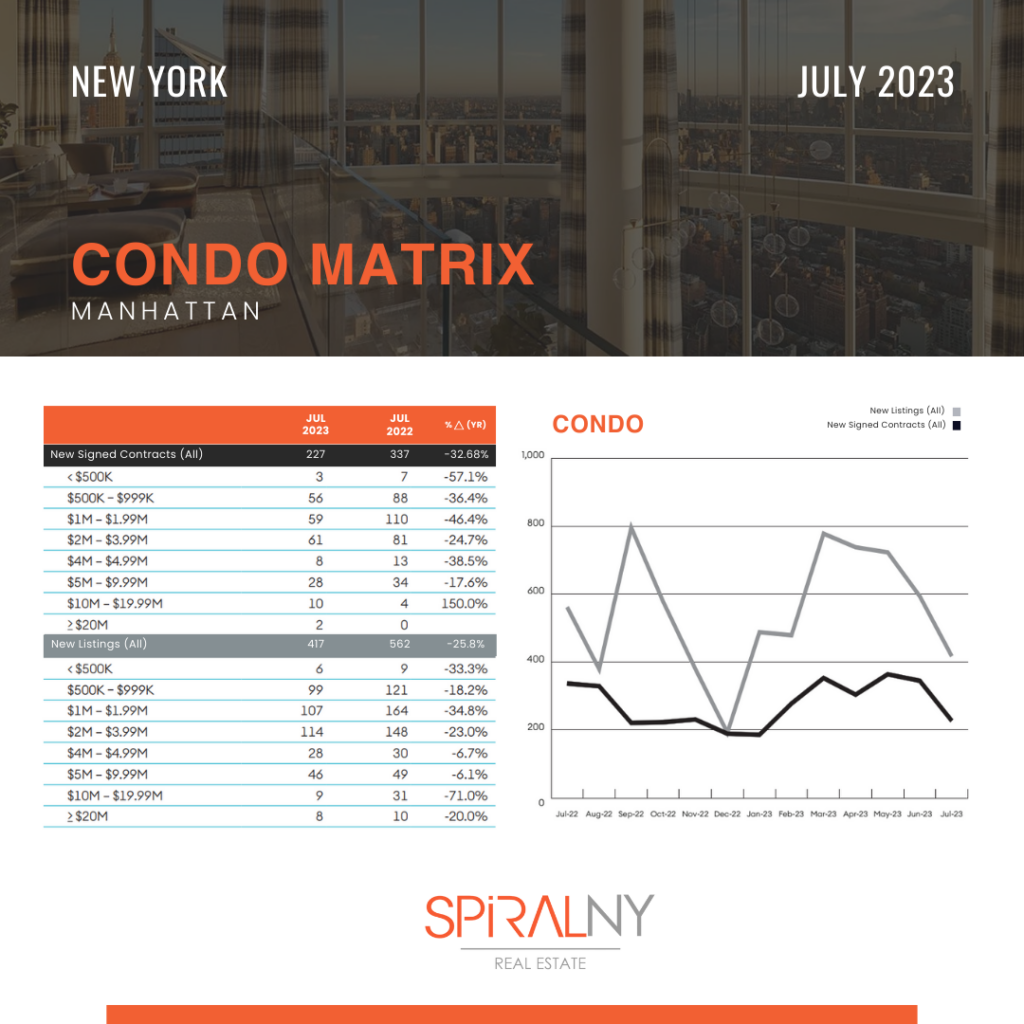
Condo Market in Manhattan:
This table provides a detailed breakdown of new signed contracts for condos in Manhattan in July 2023, compared to the same period in the previous year. The data shows a decrease of 32.6% in the number of new contracts, falling from 337 in 2022 to 227 in 2023. This suggests a slowdown in the condo market in Manhattan.
When we look at the price range breakdown, the most significant decline was observed in the less than $500K price range. Here, the number of contracts fell by a staggering 57.1%, from 7 in 2022 to just 3 in 2023. This could indicate that fewer lower-priced condos are available or that buyers in this price range are less active or facing more competition.
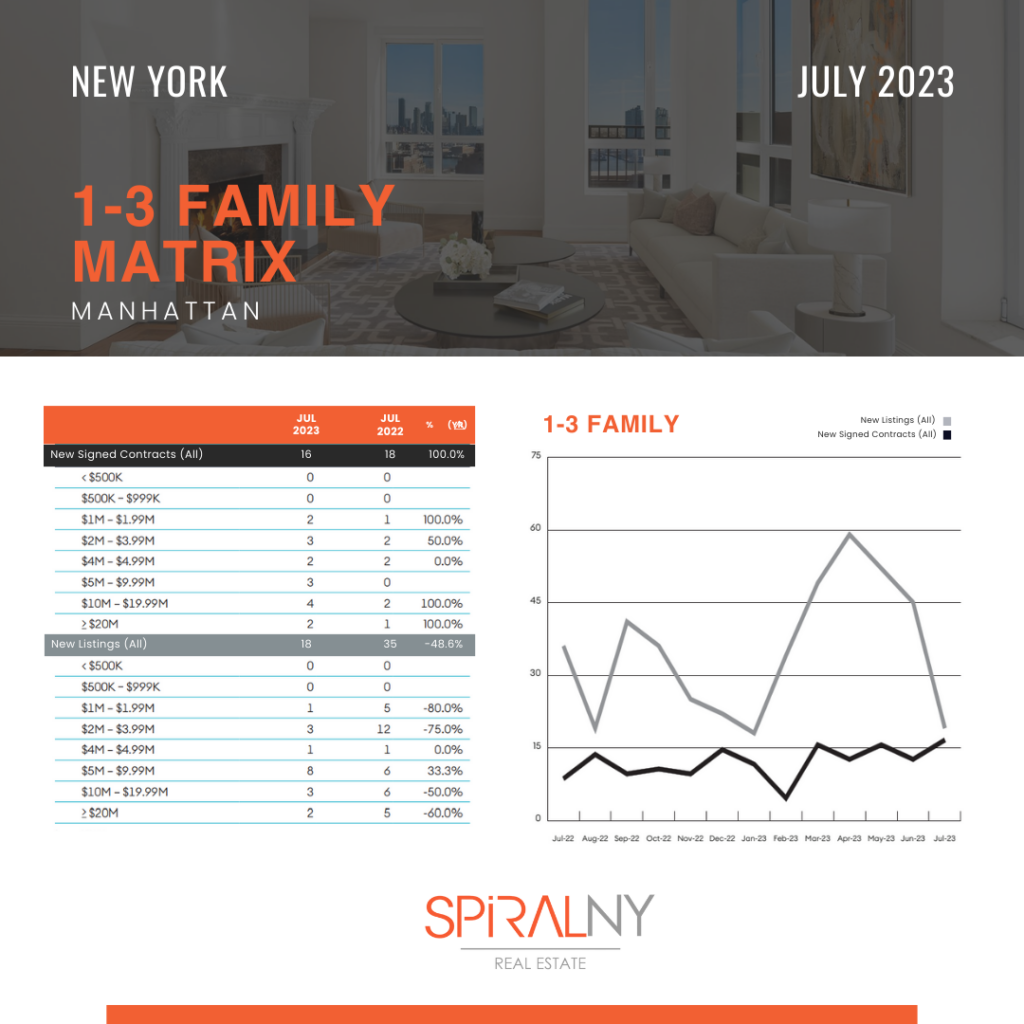
Rising Demand for 1-3 Family Homes in Manhattan:
This table paints a different picture from the condo market. The number of new signed contracts for 1-3 family homes in Manhattan saw a significant increase, doubling from 8 in 2022 to 16 in 2023. This 100% increase suggests a growing interest in this type of property within Manhattan.
This could be due to a variety of factors, including changes in buyer preferences, the availability of these types of homes, or shifts in the broader housing market. Regardless of the cause, this increase indicates a robust market for 1-3 family homes in Manhattan.
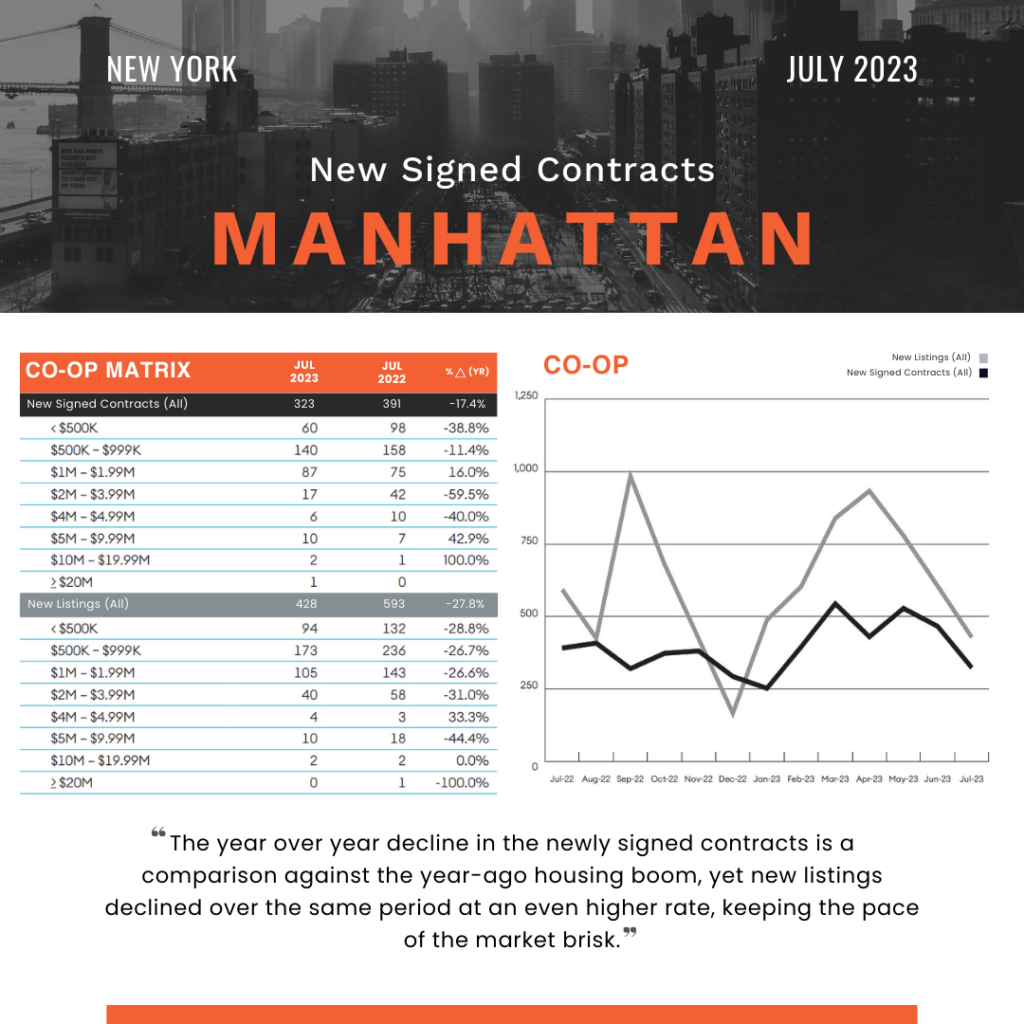
Manhattan’s Co-op Market:
Shows a decrease in new signed contracts from 391 in 2022 to 323 in 2023, a drop of 17.4%. This suggests that the co-op market in Manhattan is experiencing a slowdown, similar to the condo market.
However, when we look at the breakdown by price range, the picture becomes more nuanced. The most significant decline was in the less than $500K price range, with a decrease of 38.8%. This could be due to similar factors as those affecting the condo market in this price range.
Interestingly, there was a 16% increase in the $1M – $1.99M price range and a 42.9% increase in the $5M – $9.99M price range. This indicates a shift towards higher-priced co-ops. It could be that buyers are looking for more luxurious options, or that more of these high-priced co-ops are coming onto the market.

In conclusion, while the overall number of new signed contracts in Manhattan decreased for condos and co-ops, there was a significant increase in 1-3 family homes. Furthermore, there seems to be a shift towards higher-priced properties in the co-op market. These trends provide valuable insights into the current state of the Manhattan real estate market.
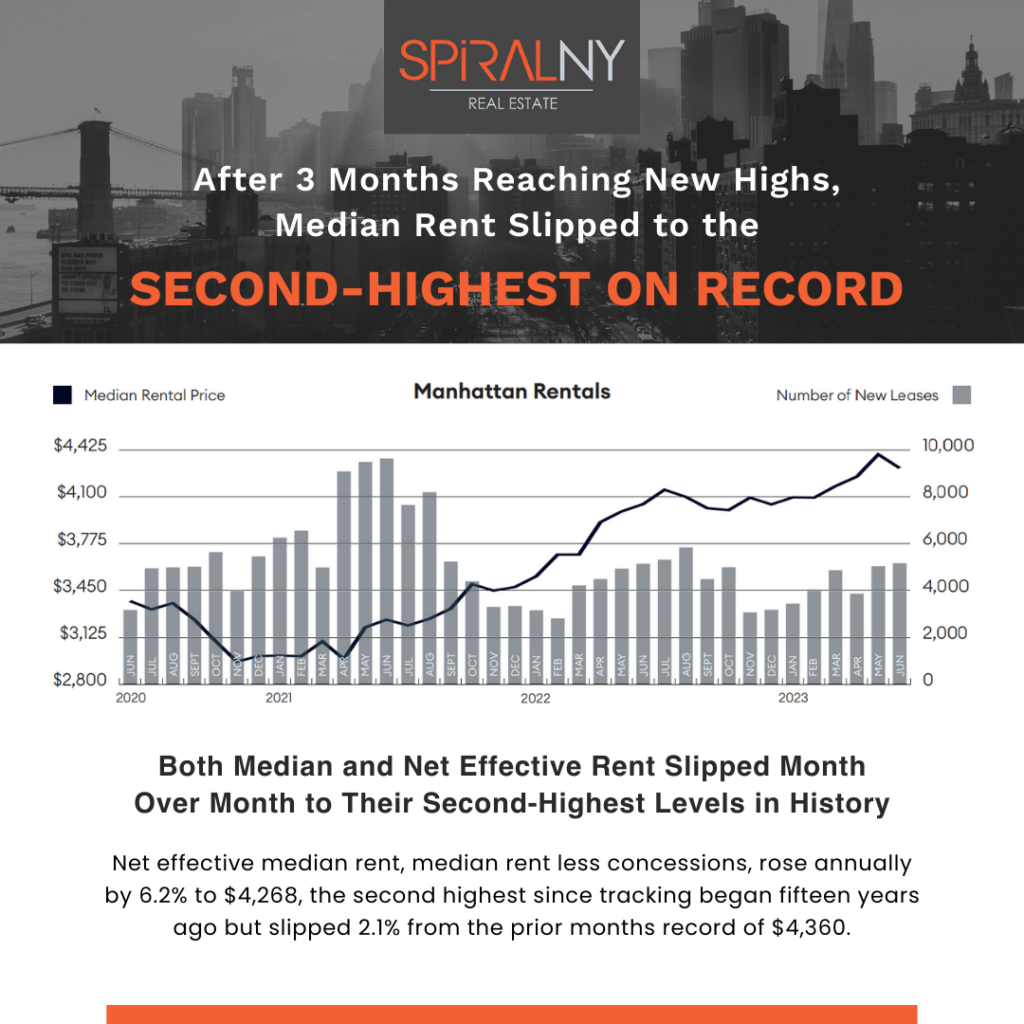
After three months of reaching new highs, median rent slipped to the second-highest on record.
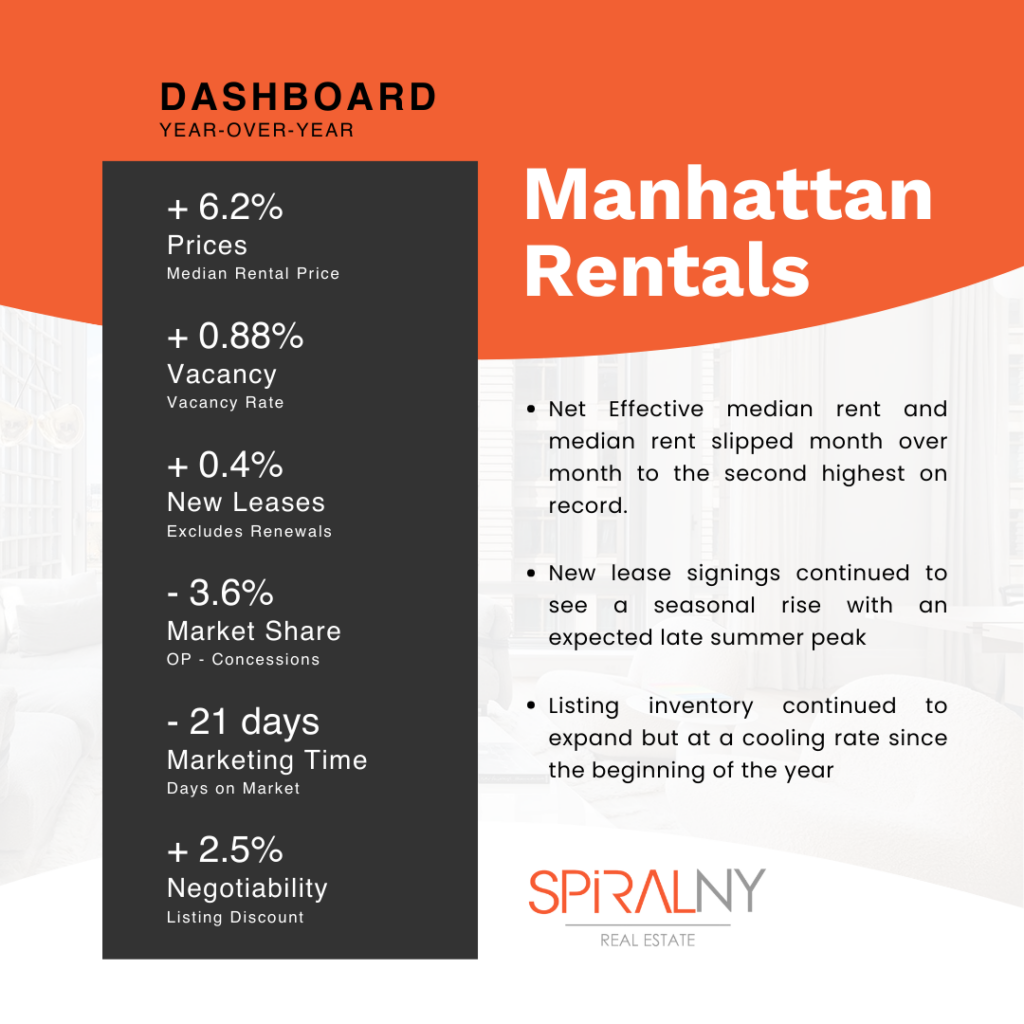
Both median and net effective median rent slipped month over month to their second-highest levels in history. Net effective median rent, median rent less concessions, rose annually by 6.2% to $4,268, the second highest since tracking began fifteen years ago but slipped 2.1% from the prior month’s record of $4,360. Median rent declined by 2.2% to $4,300, the second-highest in history, after reaching new highs for the previous three months.
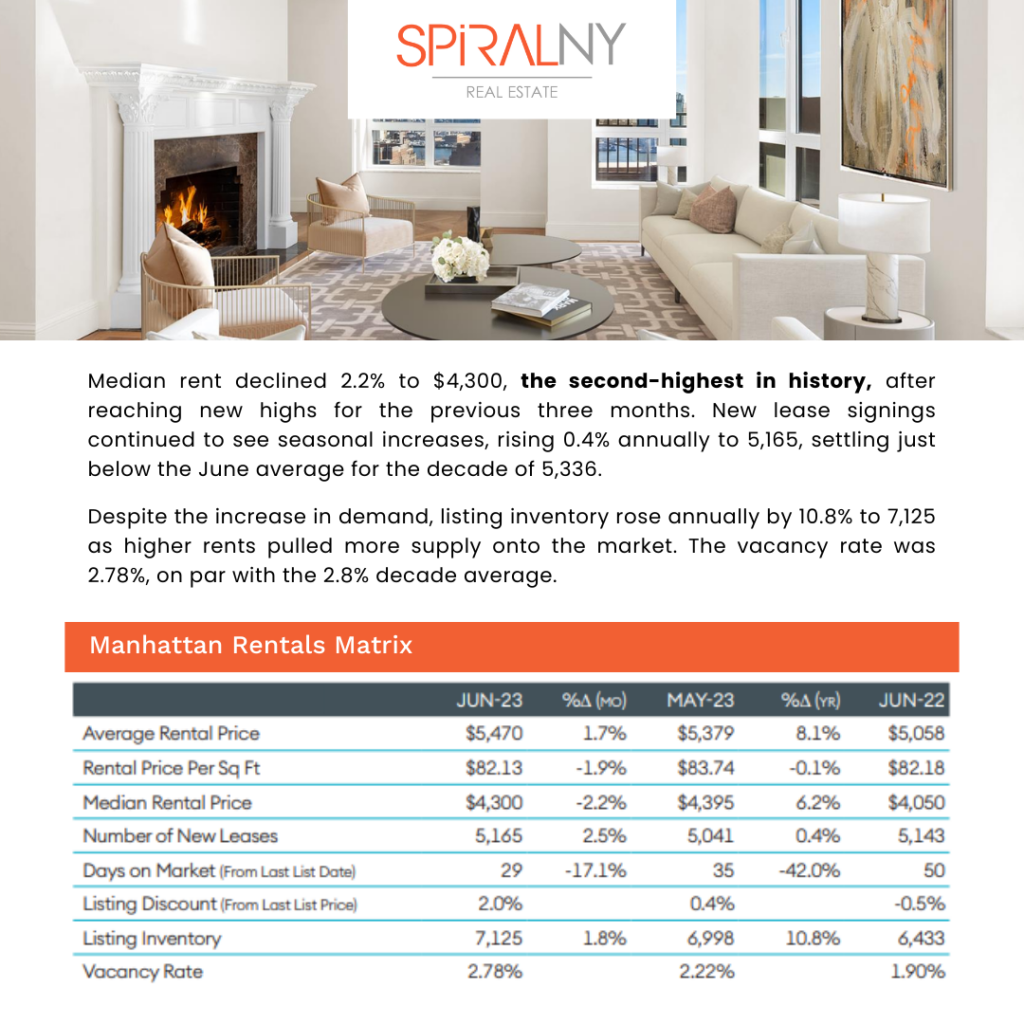
New lease signings continued to see seasonal increases, rising 0.4% annually to 5,165, settling just below the June average for the decade of 5,336. Despite the increase in demand, listing inventory rose annually by 10.8% to 7,125 as higher rents pulled more supply onto the market. The vacancy rate was 2.78%, on par with the 2.8% decade average.
The market share of landlord concessions slipped annually to 10.5% from 14.1% in the same period last year. The average landlord concession, comprised mainly of free rent and brokerage commissions, was 1.2 months of equivalent rent, down 25% year over year and tied with April and May for the lowest since the pandemic’s start. The market share of bidding wars, a proxy for rents above the landlord’s asking price, was 15.9% from 22% in the prior year, a record, with a premium paid of 8.6%.
About SPiRALNY
Focused on providing a full-service real estate experience, SPiRALNY strives to answer the needs of clients with a sense of detail, care, and efficiency. Our agents work tirelessly to make the process of buying, selling, or renting seamless and exciting.
With an encouraging company culture, cutting-edge technology, and extensive training resources, SPiRALNY agents are destined for success.